October 2026
Use Case: Quantitative DCE-MRI Perfusion Mapping for Prostate Cancer
DCE-MRI perfusion analysis of prostate lesions with three arterial input functions, in collaboration with the Masaryk Memorial Cancer Institute in Brno.
We present results of a pilot study on clinical prostate MRI data acquired at the Masaryk Memorial Cancer Institute (MMCI) in Brno. Twenty-six patients with biopsy-verified prostate lesions were examined on a 3 T scanner (MAGNETOM Vida, Siemens Healthineers) with a dynamic T1-weighted GRASP acquisition at a temporal resolution of 2 s per frame.
Multiparametric MRI (T2W + DWI + DCE) is the clinical standard for prostate cancer diagnosis, but the DCE part is currently assessed only qualitatively in PI-RADS scoring. Quantitative perfusion parameters describe tumour vasculature directly and could help to separate clinically significant from clinically insignificant cancer. Their values, however, depend on how the arterial input function (AIF) is obtained, which is one of the main obstacles to their clinical use.
The aim of this analysis is to test whether perfusion parameters estimated in PerfLab are associated with tumour aggressiveness (ISUP grade group), and how this association depends on the choice of AIF.
Parameters and models
The AATH (adiabatic approximation of the tissue homogeneity) model describes the tissue by the plasma flow Fp, the plasma volume fraction vp, the extravascular extracellular volume fraction ve, the capillary transit time Tc and the extraction fraction E. From these, the volume transfer constant Ktrans and the rate constant kep are derived, so the results can be compared with studies using the Tofts model.
Three AIFs were compared:
- blind deconvolution: the AIF is estimated from the patient's own tissue curves
- Horsfield population AIF
- Parker population AIF
Data processing
Of 31 lesions identified in the 26 patients, 8 were excluded because of low signal-to-noise ratio and 4 because they lay in the transition zone, leaving 19 peripheral-zone lesions: ISUP 0 (n = 2), ISUP 1 (n = 4), ISUP 2 (n = 9), ISUP 3 (n = 3) and ISUP 5 (n = 1).
The AATH model was fitted voxel-wise in PerfLab with each of the three AIFs. Lesion values were expressed as a ratio to normal-appearing peripheral-zone tissue of the same patient, which reduces the influence of inter-patient differences. The association with ISUP grade was assessed with Spearman correlation, and the separation of clinically insignificant (ISUP 1, n = 4) from clinically significant cancer (ISUP ≥ 2, n = 13) with ROC analysis.
Results
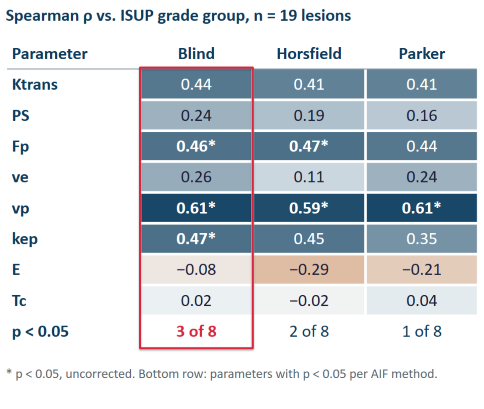
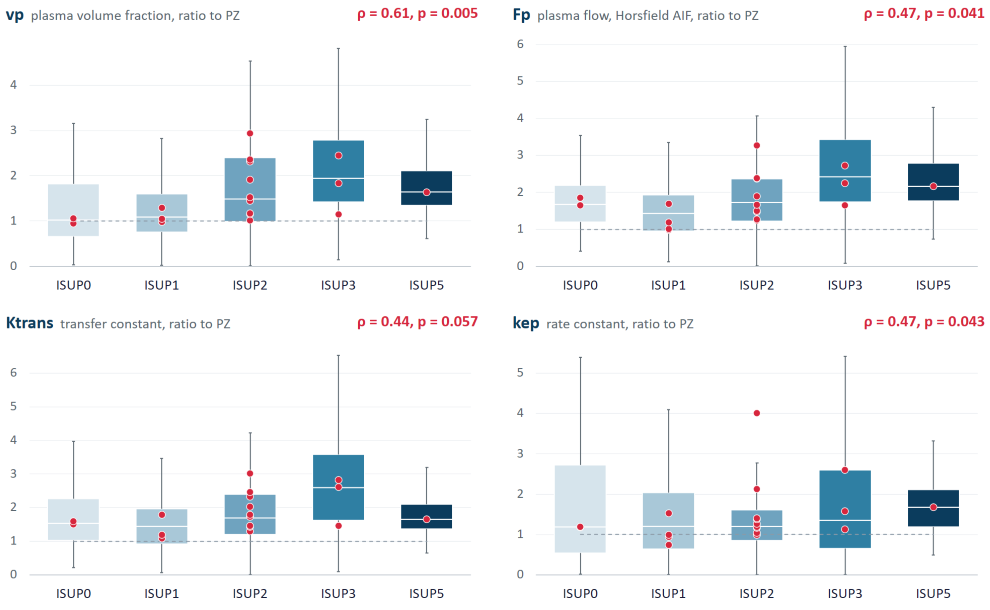
With the blind-deconvolution AIF, the perfusion parameters showed the strongest association with ISUP grade: it gave the highest or tied-highest correlation for 5 of the 8 parameters shown in Figure 1. Three parameters reached statistical significance: plasma volume vp (ρ = 0.61), plasma flow Fp (ρ = 0.46) and kep (ρ = 0.47); Ktrans showed a trend (ρ = 0.44, p = 0.057). Plasma volume was the most robust parameter, significant under all three AIFs (ρ = 0.59–0.61). The extraction fraction E and the transit time Tc showed no association with ISUP grade.
The boxplots below show how the parameter values increase with ISUP grade.
In the ROC analysis, Ktrans, Fp and vp separated clinically insignificant from clinically significant cancer with AUC of about 0.85–0.88 under all three AIFs. The best result was obtained for Ktrans with the blind AIF (AUC 0.88, 95% CI 0.65–1.00). For comparison, a recent study on 88 lesions (Zhang et al., 2026) reported AUC 0.83 for Fp and 0.81 for vp.
Limitations
The cohort is small: 19 lesions, of which only 4 are clinically insignificant cancer, so the confidence intervals of the AUC values are wide. Some ISUP groups are represented by one or two lesions (ISUP 0, ISUP 5) and ISUP 4 is absent. Transition-zone lesions were excluded, which limits the generalisability of the findings. The results show a consistent trend rather than a validated biomarker, and they were not compared with the PI-RADS assessment by radiologists.
Summary
Plasma volume, plasma flow and kep estimated in PerfLab increase with ISUP grade, and Ktrans showed the same trend. The blind AIF gave the strongest associations, and plasma volume remained significant regardless of the AIF used. The next step is a larger prospective cohort.
Reference: Zhang H, Du J, Lei J, et al. Detecting clinically significant prostate cancer with a distributed parameter model based on quantitative dynamic contrast-enhanced magnetic resonance imaging. Quant Imaging Med Surg 2026;16(7):548. doi:10.21037/qims-2025-1-2717