August 2026
Use Case: Quantifying the Effects of Focused Ultrasound in Tumors
DCE-MRI perfusion analysis of preclinical tumor data acquired with and without focused-ultrasound blood-brain barrier disruption.
We present results on data originating from Stanford University (see the original study), processed earlier within the canSERV project, carried out in collaboration with the Luxembourg Institute of Health. Here, we present a follow-up analysis of the biological effects of focused ultrasound (FUS) on perfusion parameters in glioblastoma tumors.
In the original study, perfusion was measured by DCE-MRI in mice with implanted glioblastoma. The animals were divided into several groups undergoing different treatment strategies involving repeated administration of microbubbles and FUS-induced blood-brain barrier disruption. The acquisition parameters and the whole experimental protocol are described in the original study. In this analysis, we selected the datasets where two DCE-MRI measurements – one without FUS applied beforehand, and one with FUS applied beforehand – were acquired within an interval of 1–4 days.
This analysis follows up on the processing done within canSERV, where parametric maps for the ETK and 2CX models were produced for the purpose of model training. FUS is expected to change the perfusion parameters of the tissue and to increase vascular permeability, which could, for example, improve the subsequent delivery of a drug into the tumor tissue. Here we focused on the biological effects of FUS and their quantification using PerfLab: we tested further models and processing options, analyzed the concentration curves in the tumors, and performed a quantitative comparison.
The aim of this analysis is to test whether DCE-MRI perfusion parameters can detect the effect of FUS, and how robust this finding is with respect to the choice of denoising, regularization and pharmacokinetic model.
Parameters and models
The extended Tofts (ETK) model describes the tissue by the volume transfer constant Ktrans (leakage of contrast agent from plasma into tissue), the extravascular extracellular volume fraction ve and the plasma volume fraction vp. The AATH (adiabatic approximation of the tissue homogeneity) model additionally accounts for the finite transit time of the contrast agent through the capillaries and provides the plasma flow Fp, the permeability-surface area product PS, the capillary transit time Tc and the extraction fraction E. Ktrans, ve and vp are therefore available from both models and can be compared directly, while Fp, PS, Tc and E are specific to AATH.
The ETK model is the most commonly used model in the literature. The AATH model is more complex and requires better data quality and advanced processing methods to fit reliably, but it can provide a more detailed description of the tissue perfusion and permeability. For example, the Ktrans parameter is a combination of Fp and PS, and the AATH model can separate these two effects, giving better insight into the physiology and, in our experiments, into the biological effects of FUS.
Methods
Eighteen pairs of datasets (without and with FUS applied) were processed in five different ways. The simplest pipeline, reflecting the standard approach used in the literature, was executed entirely in PerfLab, while the four more advanced pipelines relied on preprocessing performed outside PerfLab.
Data preprocessing
For the four advanced pipelines, the data were denoised using BART toolbox (v1.0) and the T1 map was estimated from the multi-flip-angle (MFA) data outside PerfLab. The denoised data and the resulting T1 maps were then imported into PerfLab for the pharmacokinetic analysis.
Pipelines in PerfLab
The five pipelines differ in the preprocessing and in the model and fitting used in PerfLab:
- no denoising, conversion by normalization only, ETK model, voxelwise fitting
- denoised, conversion with precomputed T1, ETK model, voxelwise fitting
- denoised, conversion with precomputed T1, ETK model, spatially-regularized fitting
- denoised, conversion with precomputed T1, AATH model, voxelwise fitting
- denoised, conversion with precomputed T1, AATH model, spatially-regularized fitting
In all cases a population AIF (the three-gamma-variate function, 3GVF, suitable for small animals; see the reference) scaled to muscle was used. Regularization used total generalized variation (TGV) applied separately in space and time, with a weight of 0.005 and, for the AATH model, a Tikhonov data term. ROIs were drawn on the single slice with the most prominent tumor, avoiding necrotic tissue; the matching slice in the second acquisition was found from anatomical similarity. Boxplots were generated from the ROI means and the Wilcoxon signed-rank test was used to assess statistical significance at the 0.05 level.
Results
Parameter maps
The viewer below shows the parameter maps for three selected animals, with and without FUS applied. Representative datasets with a one-day interval were selected for this visualization.
Switch between animals with the buttons above the image, and between parameters with the buttons below the image or with the left/right arrow keys.
Figure 1: , parameter map, with and without FUS.
Effect of FUS on the common parameters
Figure 2 compares Ktrans, ve and vp, averaged over the ROI of each animal, before and after FUS for each processing pipeline. We were able to observe changes in the perfusion parameters between the two measurements. The trend is towards higher Ktrans, ve and vp after FUS (kep, which decreases, is not shown), consistent with the expected increase in vessel permeability, with vasodilation and vessel recruitment raising vp and fluid leakage into the interstitium (edema) expanding ve.
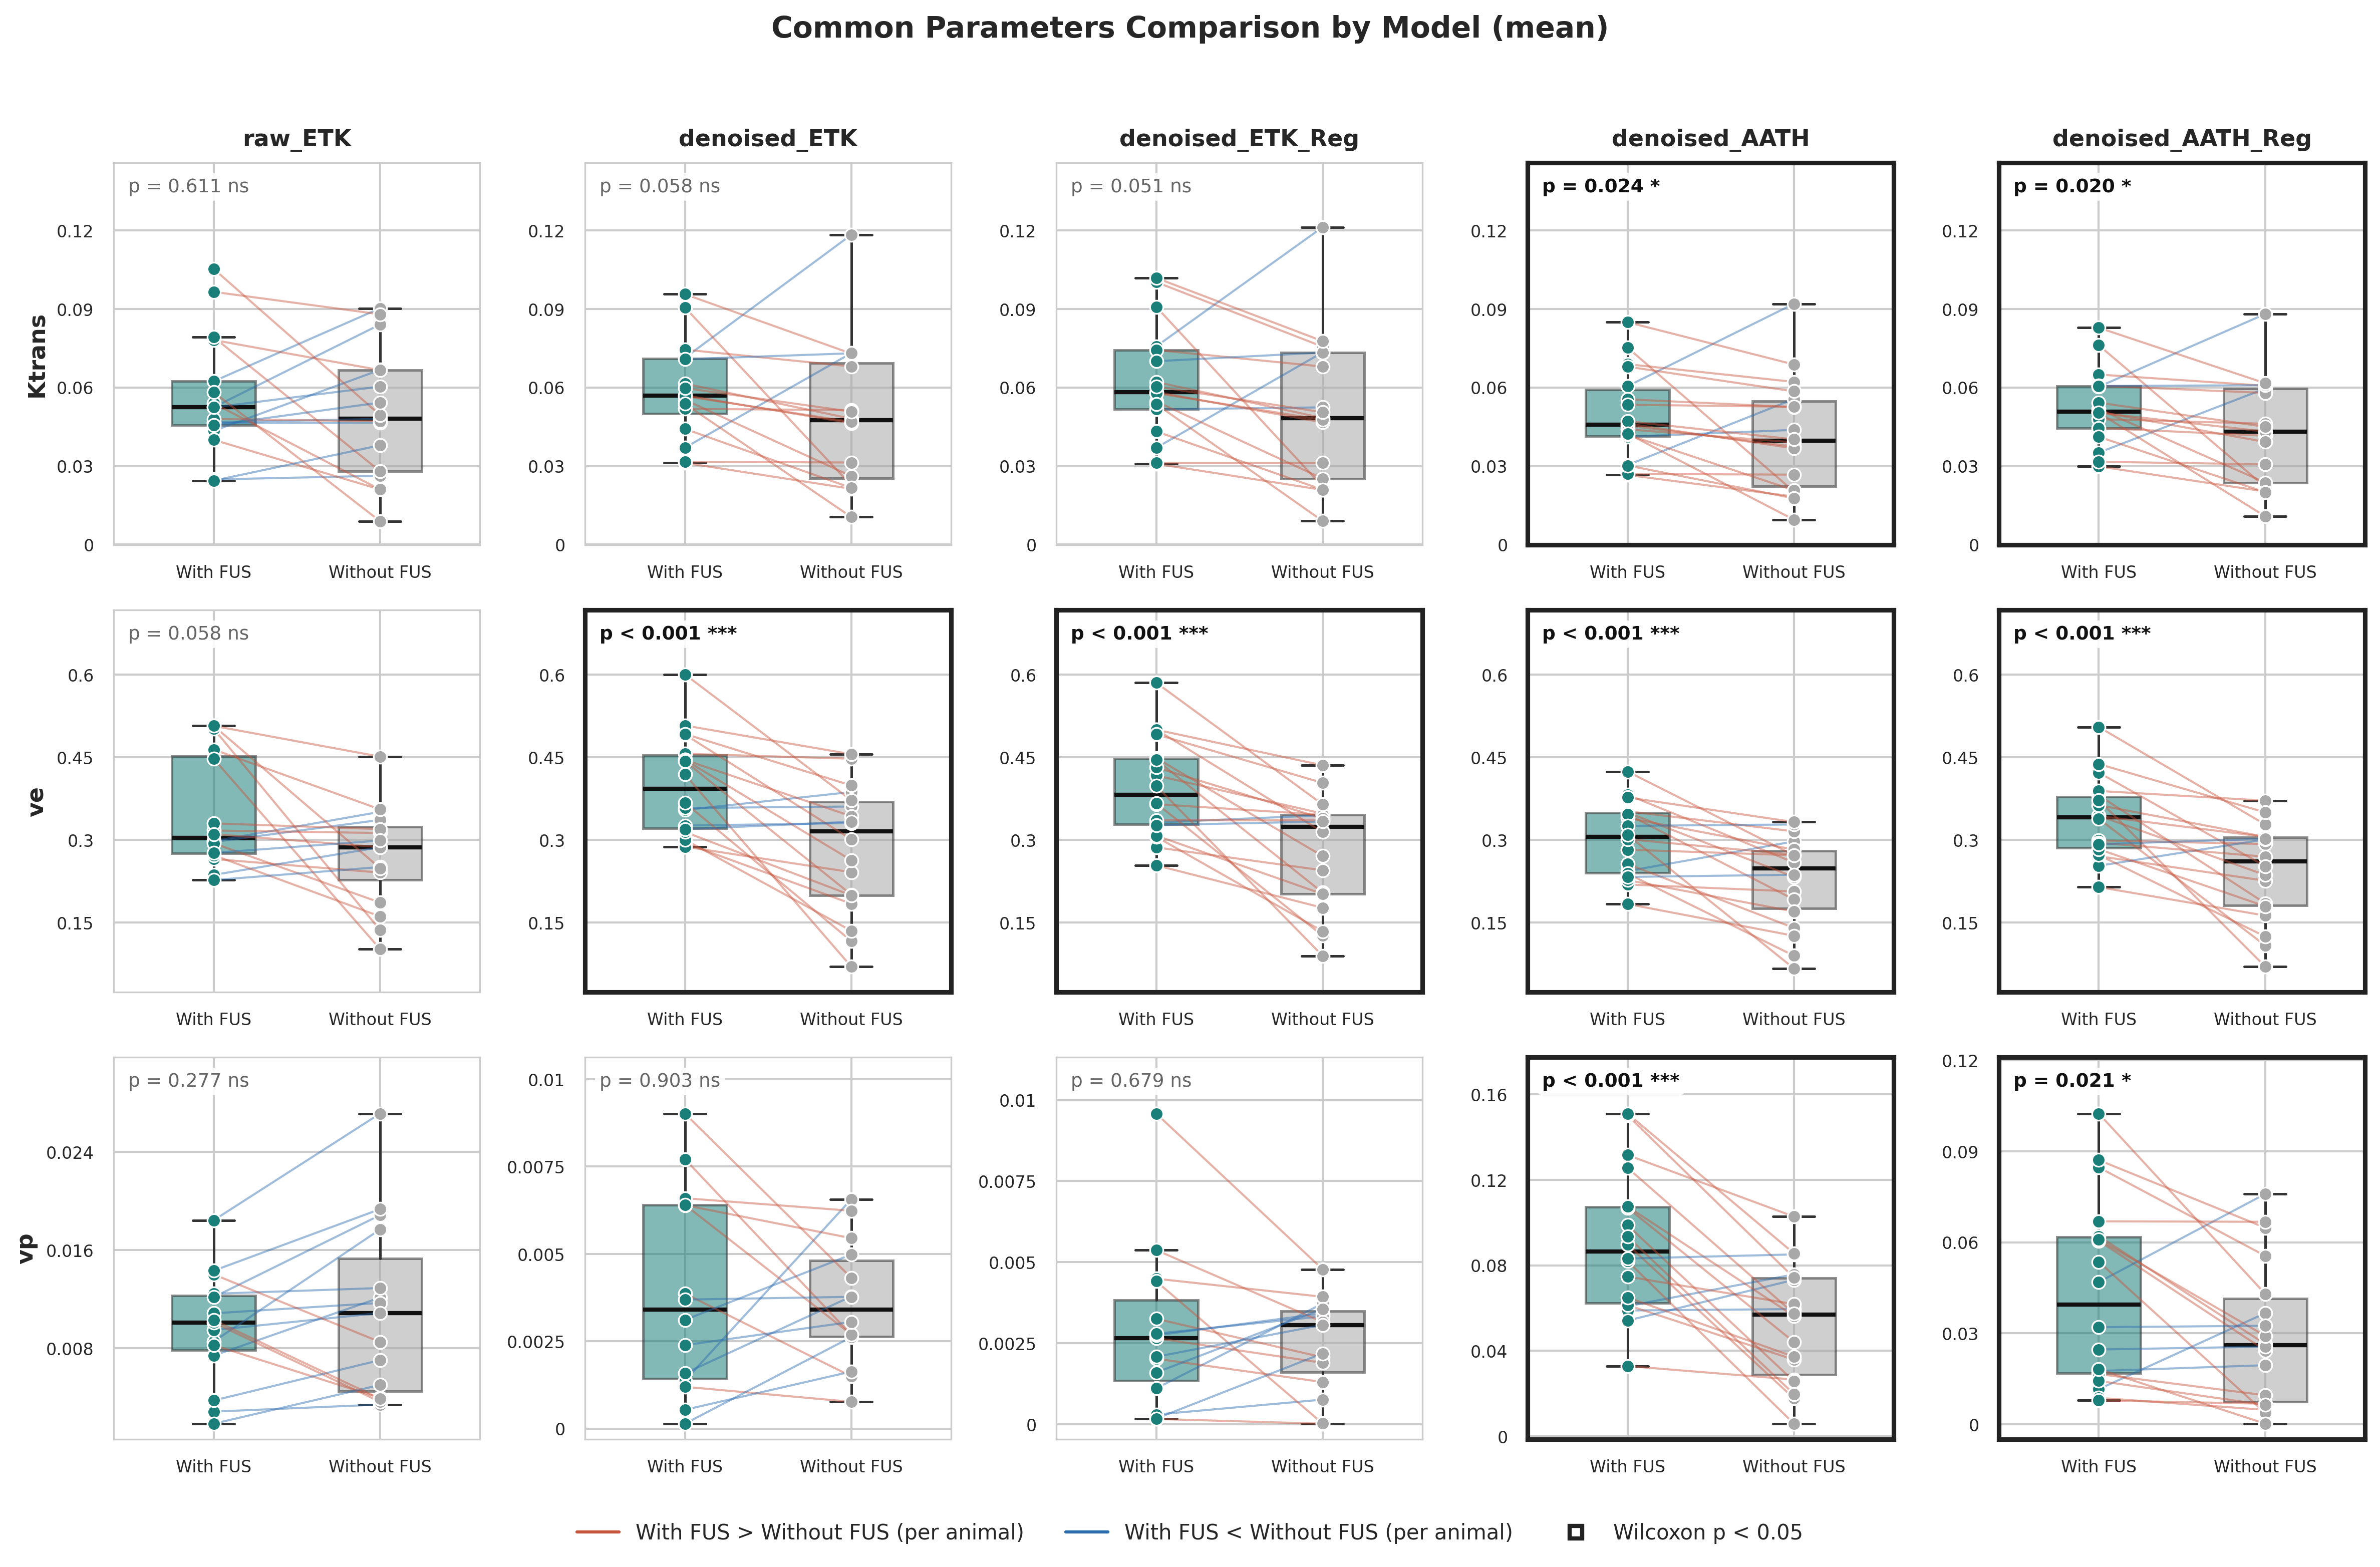
Statistical significance (Wilcoxon signed-rank test, framed panels in the figures) differs between the models: the AATH model detects significant changes in all three common parameters, whereas the ETK model detects a significant change only in ve, and only in the pipelines with denoising and MFA-based conversion.
Comparison of processing pipelines
Results without denoising and with normalization-only conversion are the least reliable of the five pipelines, as shown by larger p-values (Figure 2) and smaller differences between the parameters in tumor for measurements with and without FUS (Figure 1). The ETK model is not able to estimate vp reliably in any of the three ETK pipelines: the values tend to converge to zero and show a large spread. For the ETK model regularization is less important, although it still reduces the spread of the values and provides more visually coherent parameter maps (Figure 1).
AATH-specific parameters
The AATH model additionally provides E, Fp, PS and Tc (Figure 3), all of which tend to be higher after FUS.
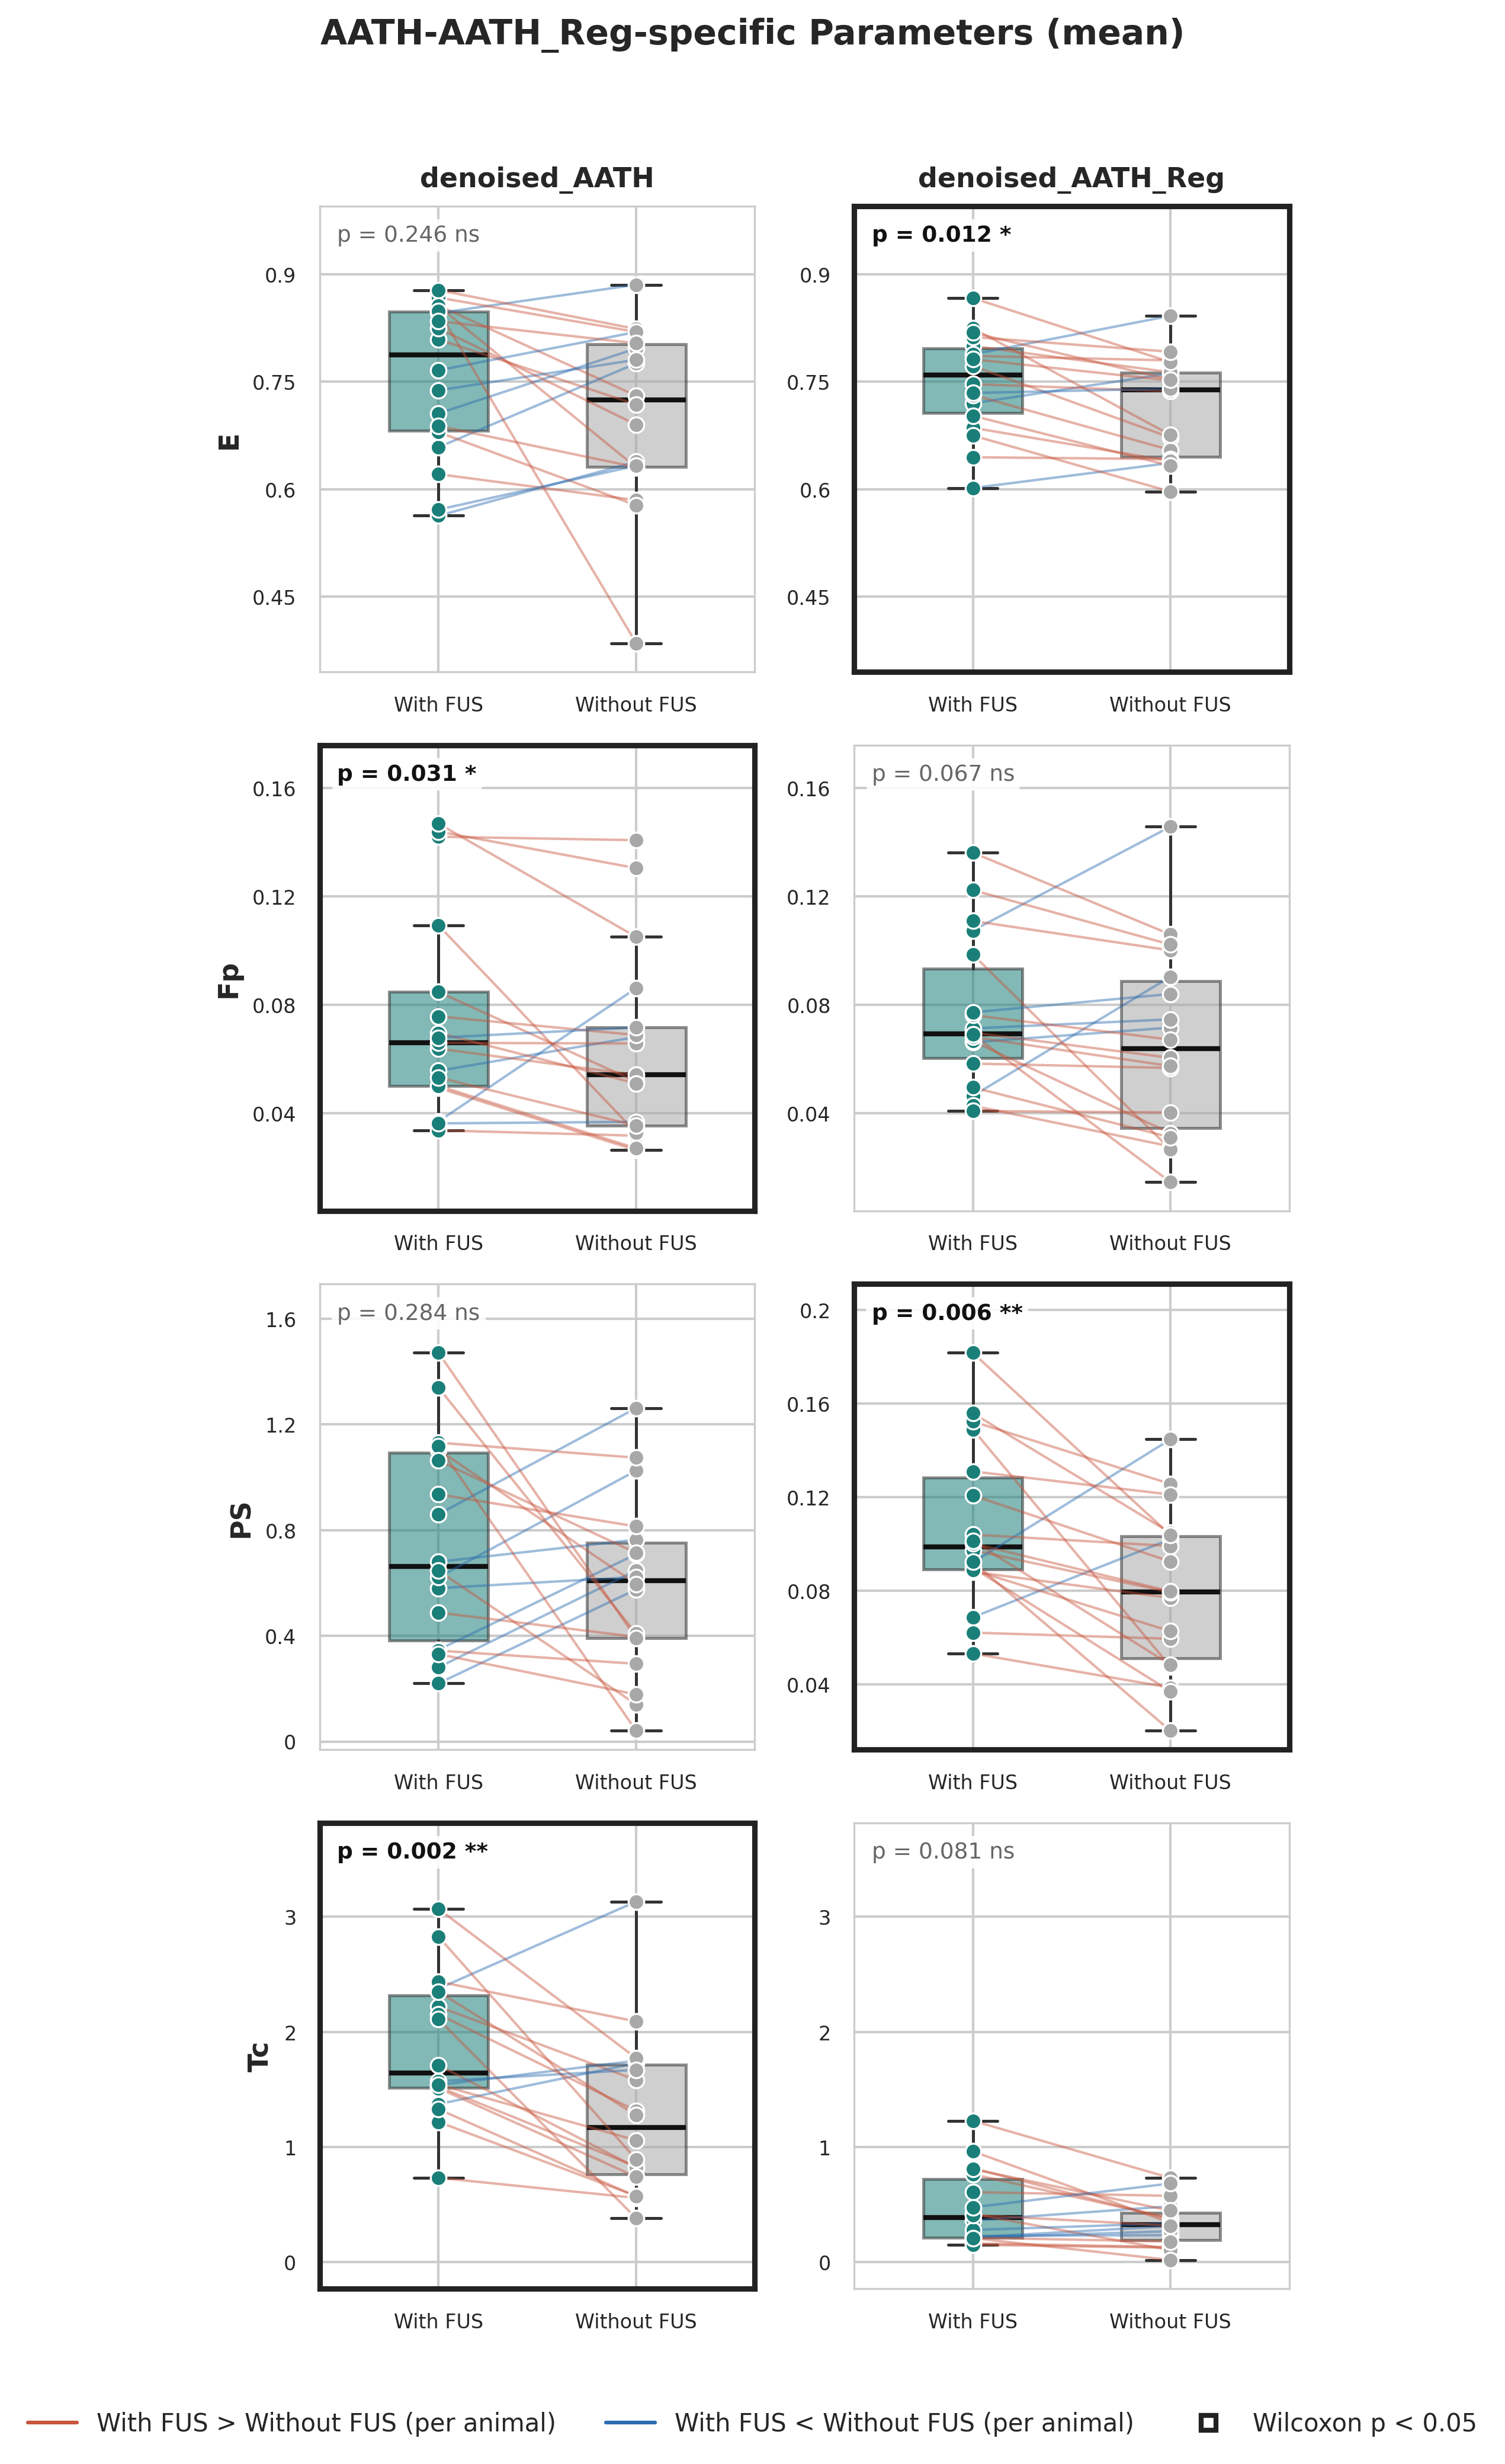
The significance of these changes varies between the voxelwise and regularized approaches, but the p-value is overall low for the regularized approach for all four parameters, whereas for voxelwise fitting the p-value for E and PS is high. Better performance of the regularized approach is apparent especially from the whole parameter maps (Figure 1), where the voxelwise maps show a large spread of values, converging often into local optima, while the regularized maps are more coherent and show a clearer difference between the two measurements.
Limitations
ROIs were drawn on a single slice per acquisition, and the corresponding slice in the second measurement was matched visually from anatomical similarity. A population AIF was used instead of a measured one, and the 1–4 days between the two measurements means that natural tumor changes may contribute to the observed differences in addition to the effect of FUS. The number of animals is limited, so the results should be regarded as preliminary; nevertheless, they show a clear trend and demonstrate the potential of DCE-MRI perfusion analysis to detect the effect of FUS.
Summary
Changes in perfusion parameters between measurements without and with FUS were observed, with a trend towards higher Ktrans, ve and vp and, for the AATH model, higher E, Fp, PS and Tc. The AATH model detected statistically significant changes in all three common parameters, while the ETK model did so only for ve. Denoising and MFA conversion are important for reliable results, and regularization reduces the spread of values for ETK and is practically required for AATH. Overall, the AATH model with denoising and regularization gives the most informative description of the effect of FUS in these data.